
Kickoff weather by network
How the weather at kickoff compared across the kickoff times used on the same Saturday, for games on different TV networks and for games not on TV. We call each kickoff time a slot: one of the kickoff times used that day in that part of the country.
This Saturday on TV, by weather
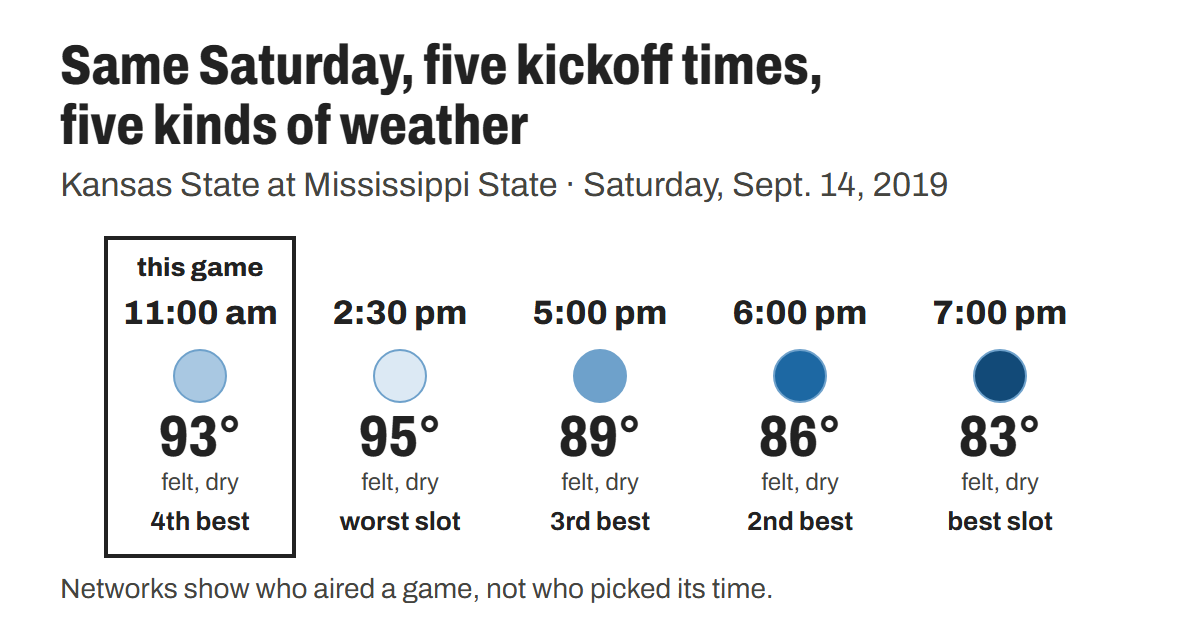
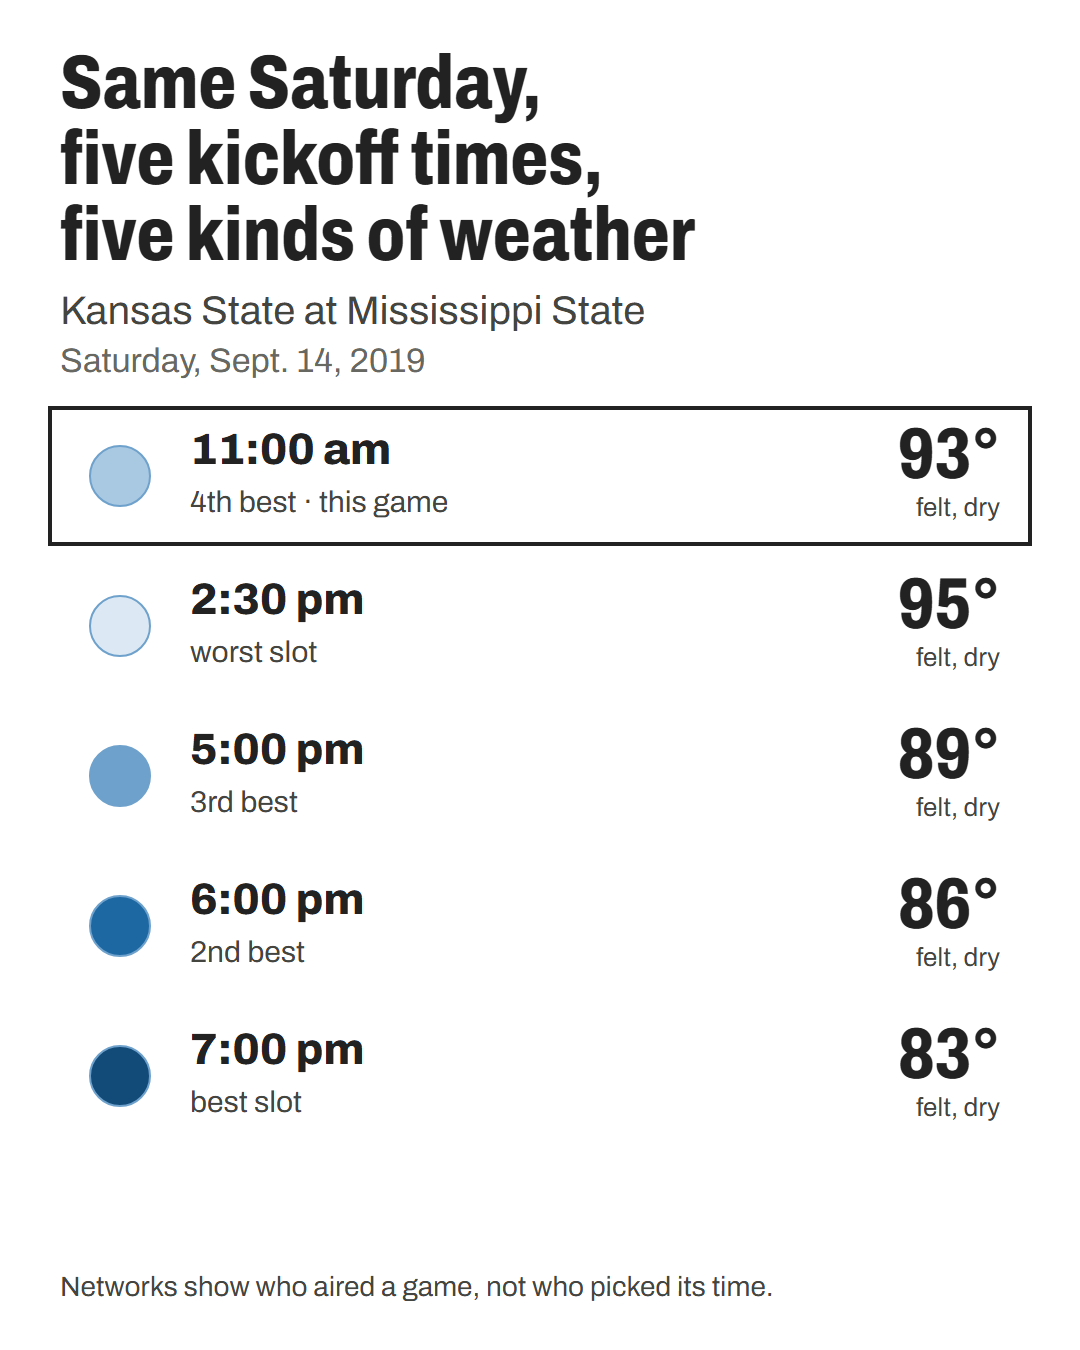
Same Saturday, five kickoff times, five kinds of weather
Kansas State at Mississippi State, Starkville, Saturday, Sept. 14, 2019. The game aired on ESPN. That day, games in that part of the country kicked off at 5 different times. We call each kickoff time a slot. Noon, 3:30 and 7:30 pm are typical slots.
- this game11:00 am93° feltdry4th best
- 2:30 pm95° feltdryworst
- 5:00 pm89° feltdry3rd best
- 6:00 pm86° feltdry2nd best
- 7:00 pm83° feltdrybest
The weather differs from slot to slot. Felt temperature ran from 83° at 7:00 pm to 95° at 2:30 pm, and no rain fell in any slot. A game kicks off in the day’s best slot, its worst slot, or somewhere in between. The chip marks each slot’s place: darkest is best, lightest is worst.
This game kicked off in the 4th best of 5 slots.
Found by this rule: a game that mattered, shown on TV, with 5 slots that day, in the 4th best of them and a clear step between every slot, where the order of felt temperature matches the order of the slots and spans 10 degrees or more. 11 games fit; this one has the widest gap between its best and worst slot.
Do some networks end up in the worse slots more than others?
To find out, we checked 3,058 games from 2018 to 2025, counting a day only when its best and worst slots really differed in weather. We sorted each game by the network that aired it.
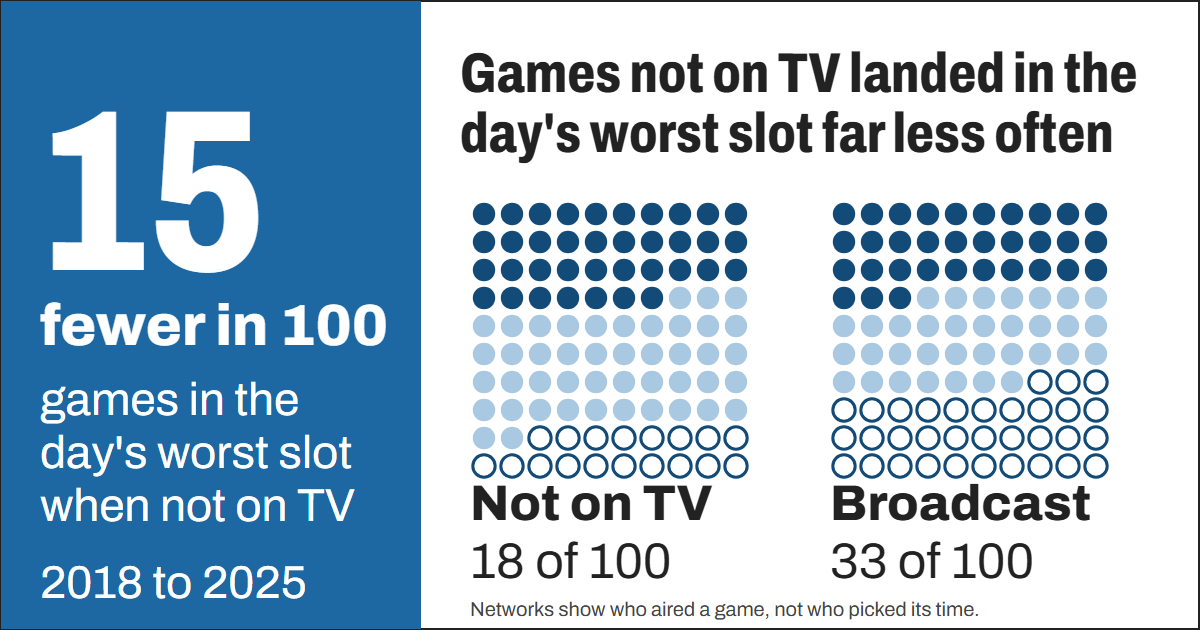
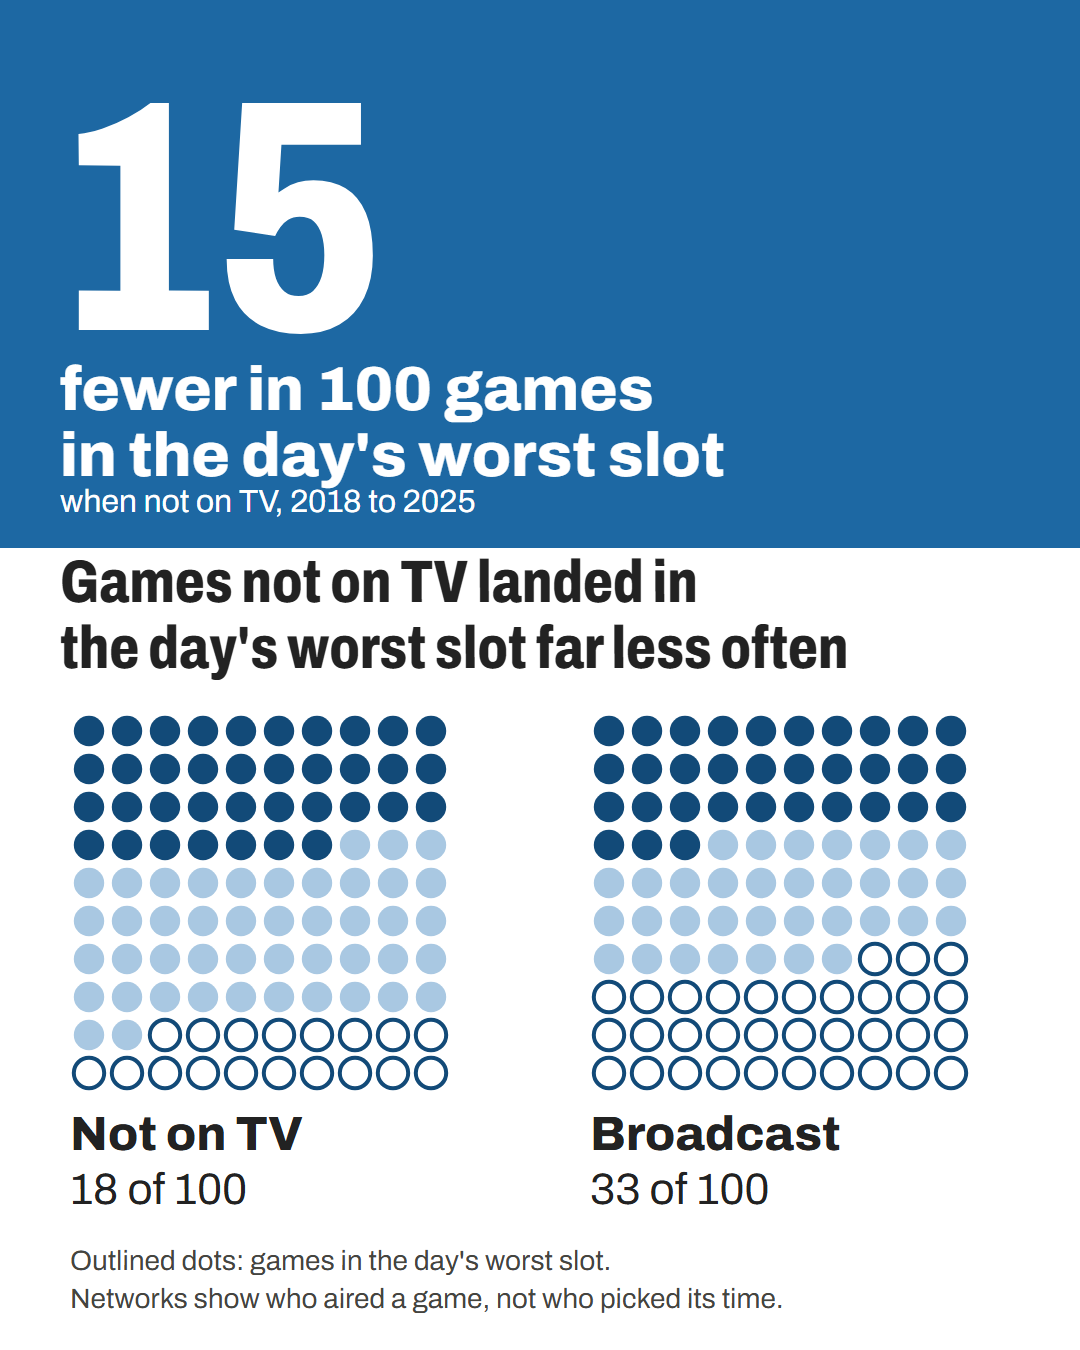
Games not on TV landed in the day's worst slot far less often, and that follows the hour of the day
Each block is 100 games. Dark dots kicked off in the day's best slot, light dots in its worst slot, medium dots somewhere in between. The tick shows where the light dots would begin if each game had kicked off in one of that day's slots, weighted by how many games used each.
Broadcast networks 441 games
ABC, CBS, FOX, NBC and The CW
Worst slot: 33 of 100 (by chance: 29). Best slot: 33 of 100 (by chance: 34).
Cable and conference networks 1,452 games
ESPN family, FS1, CBS Sports Network, and the Big Ten, SEC, ACC and Pac-12 networks
Worst slot: 29 of 100 (by chance: 29). Best slot: 36 of 100 (by chance: 35).
Games not on linear TV 1,117 games
No TV listing: streaming, radio or nothing listed
Worst slot: 18 of 100 (by chance: 28). Best slot: 37 of 100 (by chance: 30).
All 3,058 games that mattered: worst slot 26 of 100 (by chance: 29), best slot 36 of 100 (by chance: 33).
Games with no TV listing differ from the rest: other stadiums, other weeks, other hours. This shows where games landed, not why.
Each network on its own
One row of 100 games per network, from the fewest games in the worst slot to the most. The tick is what chance would give.
- CBS Sports Network160 games21 of 100 in the worst slot
Worst slot in 21 of 100 games; by chance 28.
- ACC Network139 games26 of 100 in the worst slot
Worst slot in 26 of 100 games; by chance 29.
- Big Ten Network150 games28 of 100 in the worst slot
Worst slot in 28 of 100 games; by chance 26.
- ESPN family729 games30 of 100 in the worst slot
ESPN, ESPN2, ESPNU, ESPNEWS and ABC
Worst slot in 30 of 100 games; by chance 30.
- FS1168 games30 of 100 in the worst slot
Worst slot in 30 of 100 games; by chance 28.
- FOX133 games31 of 100 in the worst slot
Worst slot in 31 of 100 games; by chance 28.
- Pac-12 Network68 games34 of 100 in the worst slot
Worst slot in 34 of 100 games; by chance 31.
- SEC Network201 games34 of 100 in the worst slot
Worst slot in 34 of 100 games; by chance 28.
- CBS64 games44 of 100 in the worst slot
Worst slot in 44 of 100 games; by chance 31.
- NBC48 games44 of 100 in the worst slot
Worst slot in 44 of 100 games; by chance 27.
- The CW23 games
4 of 23 games in the worst slot; too few to compare.
Most gaps here are within what chance allows for this many games. CBS (64 games, 44 of 100 in the worst slot against 31 by chance) looks different, but it did not hold up under our strict check. NBC's 48 games show a similar share, within what chance allows for so few games. The same pattern appears when every slot is given the weather that is typical for its date, so it follows the hour of the day, not the day's weather.
Networks show who aired a game, not who picked its time. A network often had only one window to use, and contracts, conference rules and other games that day all shape kickoffs.
The prime afternoon slots sit in the roughest hours
The band shows the weather in each hour of the day, compared with the rest of that day's slots, averaged over 2018 to 2025 game days. Darker is milder. Below it, the hours when each group's games kicked off.
Broadcast networks 441 games kicked off
Cable and conference networks 1,452 games kicked off
Games not on linear TV 1,117 games kicked off
Local time. Bar height is the share of that group’s games kicking off in the hour.
| Group | 2 to 4 pm | 6 to 8 pm |
|---|---|---|
| Broadcast networks | 39% | 24% |
| Cable and conference networks | 25% | 28% |
| Games not on linear TV | 29% | 46% |
It follows the hour of the day, not the day's weather.
Find your team
59 teams have enough TV-listed games for a page of their own: at least 30 home games on TV since 2018, 15 of them on days when the slots differed in weather. The rest do not, and we do not guess.
- Alabama
- Arizona
- Arizona State
- Arkansas
- Army
- Auburn
- Baylor
- Boston College
- Clemson
- Colorado
- Florida
- Florida State
- Georgia
- Illinois
- Indiana
- Iowa
- Iowa State
- Kansas State
- Kentucky
- LSU
- Louisville
- Maryland
- Miami
- Michigan
- Michigan State
- Minnesota
- Mississippi State
- Missouri
- NC State
- Nebraska
- North Carolina
- Northwestern
- Notre Dame
- Ohio State
- Oklahoma
- Oklahoma State
- Ole Miss
- Oregon
- Penn State
- Purdue
- Rutgers
- SMU
- San Diego State
- South Carolina
- TCU
- Tennessee
- Texas
- Texas A&M
- Texas Tech
- UCLA
- Utah
- Vanderbilt
- Virginia
- Virginia Tech
- Wake Forest
- Washington
- Washington State
- West Virginia
- Wisconsin
How we checked this
The weather scores
Each slot gets a 0 to 100 weather score built from the weather in the game’s first hours: felt temperature, rain, wind gusts, and smaller terms for storms, fog and a falling temperature. Higher is easier to watch in. A day counts as one that mattered when its best and worst slots were at least 10 points apart. Kickoff times within 30 minutes of each other form one slot. A slot counts as the day’s best (or worst) only when no other slot is clearly better (or worse); slots within 3 points of each other are tied. That gives 3,058 games, and the weather behind the band is the same score. Weather is read at the stadium’s nearest airport; a gauge or a gust can differ in the stands.
The dots and chance
Best and worst slot are rounded to whole dots out of 100, and the in between dots are the rest. For each game, chance is the share of that day’s slots, weighted by how many games used each, that would be the best (or worst); the tick is the sum over a group’s games. Numbers behind every row:
| Group | Games | Best slot | In between | Worst slot | Best by chance | Worst by chance |
|---|---|---|---|---|---|---|
| Broadcast networks | 441 | 147 (33.3%) | 148 | 146 (33.1%) | 34.4% | 29.2% |
| Cable and conference networks | 1,452 | 529 (36.4%) | 499 | 424 (29.2%) | 34.8% | 28.7% |
| Not on linear TV | 1,117 | 418 (37.4%) | 494 | 205 (18.4%) | 30.4% | 28.2% |
| All games that mattered | 3,058 | 1116 (36.5%) | 1154 | 788 (25.8%) | 33.0% | 28.6% |
| ESPN family | 729 | 259 (35.5%) | 249 | 221 (30.3%) | 32.4% | 29.8% |
| FOX | 133 | 49 (36.8%) | 43 | 41 (30.8%) | 37.3% | 27.8% |
| FS1 | 168 | 51 (30.4%) | 66 | 51 (30.4%) | 37.0% | 27.8% |
| CBS | 64 | 15 (23.4%) | 21 | 28 (43.8%) | 31.1% | 30.9% |
| NBC | 48 | 19 (39.6%) | 8 | 21 (43.8%) | 36.5% | 26.9% |
| Big Ten Network | 150 | 52 (34.7%) | 56 | 42 (28.0%) | 39.3% | 26.5% |
| SEC Network | 201 | 75 (37.3%) | 57 | 69 (34.3%) | 32.6% | 28.2% |
| ACC Network | 139 | 49 (35.3%) | 54 | 36 (25.9%) | 31.7% | 29.4% |
| Pac-12 Network | 68 | 27 (39.7%) | 18 | 23 (33.8%) | 43.8% | 31.2% |
| CBS Sports Network | 160 | 68 (42.5%) | 59 | 33 (20.6%) | 38.3% | 28.0% |
| The CW | 23 | 9 (39.1%) | 10 | 4 (17.4%) | 36.5% | 26.5% |
| Other | 7 | 3 (42.9%) | 3 | 1 (14.3%) | 35.7% | 28.6% |
The ESPN family row mixes broadcast (ABC) and cable networks. The three groups hold 3,010 places for 3,058 games: 7 games list networks in more than one group, and 55 games have a TV listing whose network we cannot name, so they sit in no group.
Shuffle test
We compared each group with the same group built by shuffling TV labels among labelled games on the same day and region (5,000 shuffles), then applied a Benjamini-Hochberg correction at 0.10 across groups with 30 or more games. Only CBS passed. After removing each conference's own average it did not pass. With 10 groups, 0 to 2 detections are expected even with no effect.
Typical-weather check
We repeated the comparison with every slot scored on the weather that is typical for the date at that stadium. The CBS pattern, and the broadcast against cable pattern, remain, so they follow the hour of the day, not the day's weather. The weather by hour:
| Hour (local) | Broadcast | Cable and conference | Not on linear TV | Score vs the rest of the day |
|---|---|---|---|---|
| 11 am | 9.5% | 12.5% | 2.7% | -3.0 points |
| 12 pm | 16.8% | 17.8% | 9.8% | -2.6 points |
| 1 pm | 2.0% | 1.8% | 6.2% | -3.6 points |
| 2 pm | 18.1% | 8.7% | 15.5% | -5.9 points |
| 3 pm | 21.1% | 16.7% | 13.8% | -4.6 points |
| 4 pm | 3.6% | 4.9% | 3.8% | -2.5 points |
| 5 pm | 2.0% | 3.1% | 2.6% | -0.1 points |
| 6 pm | 9.3% | 12.3% | 32.2% | +6.4 points |
| 7 pm | 14.3% | 16.2% | 13.3% | +7.3 points |
| 8 pm | 1.8% | 5.9% | 0.2% | +7.1 points |
Hand check, coverage, power, false detections
- Hand check: 50 sampled games against wikipedia schedule tables: 50 of 50 match. One secondary source only.
- Coverage: scored games with no TV listing run between 23% and 37% of each season from 2018 to 2025 (2020 is the low). Most are streaming-only: 947 of the 1,117 games that mattered and were not on linear TV list a streaming or radio outlet, and 170 list nothing. They are a different set of games, not a sample of the others.
- Power: a gap the size of the largest one here reaches our threshold in about half of trials with 64 games. Groups with no detection are not shown to be clean.
- False detections: on label-shuffled data the test reports a detection in 13.3% of 150 runs (target at most 10%), so one detection among ten groups carries little weight.
The earlier figures, in points
Averaged over each group's days on the 100-point scale, broadcast networks' slots sat about 1.7 points (1.652 before rounding) below cable and conference networks' slots. Games on linear TV against games not on it: about 1.6 points apart after removing each stadium's own average (about 3.7 raw). The largest gap for any single network was 2.6 points (CBS, the one that did not hold up under the strict check). The typical-weather check shows the same splits.
Not claimed
That any network or anyone else had a say in a kickoff time, or why a gap exists; that a gap is about the day's weather rather than the hour; that the groups carry comparable games (they differ by conference, stadium, week and hour, and streaming-only games are a different set of games); that a TV listing equals what viewers saw (CFBD may list the scheduled network); that families are equally good groupings; that the ordering would hold in other seasons; that a point of score is a point of fan experience; that a forecast score equals the score of the game as played.
Networks show who aired a game, not who picked its time. A network often had only one window to use, and contracts, conference rules and other games that day all shape kickoffs.